Method
We present a new method to classify the broad-band optical–near-infrared spectral energy distributions (SEDs) of galaxies using three shape parameters (super-colours) based on a principal component analysis of model SEDs. As well as providing a compact representation of the wide variety of SED shapes, the method allows for easy visualization of information loss and biases caused by the incomplete sampling of the rest-frame SED as a function of redshift.
The new method allows to:
- stack SEDs of galaxies at different redshifts with the same SED shapes to better constrain mean physical properties;
- compare observed colours of galaxies without relying on the spectral synthesis models to be accurate, unlike traditional K-corrections;
- easily visualise loss of information and biases caused by the incomplete sampling of the rest-frame SED as a function of redshift and SED shape;
- investigate the potential of broad-band photometric data sets for revealing unusual classes of galaxies.
We apply the method to galaxies in the United Kingdom Infrared Telescope Infrared Deep Sky Survey Ultra Deep Survey with 0.9 < z < 1.2, and confirm our classifications by stacking rest-frame optical spectra for a fraction of objects in each class. As well as cleanly separating a tight red sequence from star-forming galaxies, three unusual populations are identifiable by their unique colours: very dusty star-forming galaxies with high metallicity and old mean stellar age; post-starburst galaxies which have formed ≳10 per cent of their mass in a recent unsustained starburst event; and metal-poor quiescent dwarf galaxies.
Conclusions
In summary our main occlusions are:
- In modern multiwavelength broad-band photometric surveys with a wide wavelength coverage, the sparse sampling of galaxy SEDs caused by the redshifts of the galaxies does not necessarily cause a dramatic loss of information on their underlying SED shape. We show that, with currently available bands in the UDS, SED shapes can be recovered robustly in the redshift ranges of 0.9 < z <1.2 and z > 1.7.
- Broad-band multiwavelength photometry can detect post starburst galaxies with similar properties to those detected in high-redshift spectroscopic surveys such as the VVDS. We detect a similar number density of post-starbursts more massive than logM∗/M > 9.75 between 0.9 < z < 1.2 (UDS, this paper) and 0.5 < z <1 (VVDS, Wild et al. 2009, MNRAS,395,144).
- Dusty star-forming galaxies can be uniquely identified, but by selection they are high-metallicity, old and very dusty. These galaxies have a mass function that is close to the red-sequence population in shape, but this is purely a selection bias as only highest metallicity, oldest and dustiest galaxies are distinguishable to the red end of the blue cloud.
- For the dustiest star-forming class, we find better consistency with models attenuated by dust using the Calzetti et al. (2000) dust attenuation law than with the CF00 law. This does not support the use of the Calzetti law for all high-redshift star-forming galaxies, however. For extremely dusty galaxies, a greyer dust attenuation curve may be caused by the high opacities to all stars at all wavelengths.
- We tentatively identify a new class of very low metallicity quiescent galaxies, which have lower luminosities and masses than typical red-sequence galaxies. This class is not distinguishable using traditional colour–colour diagrams.
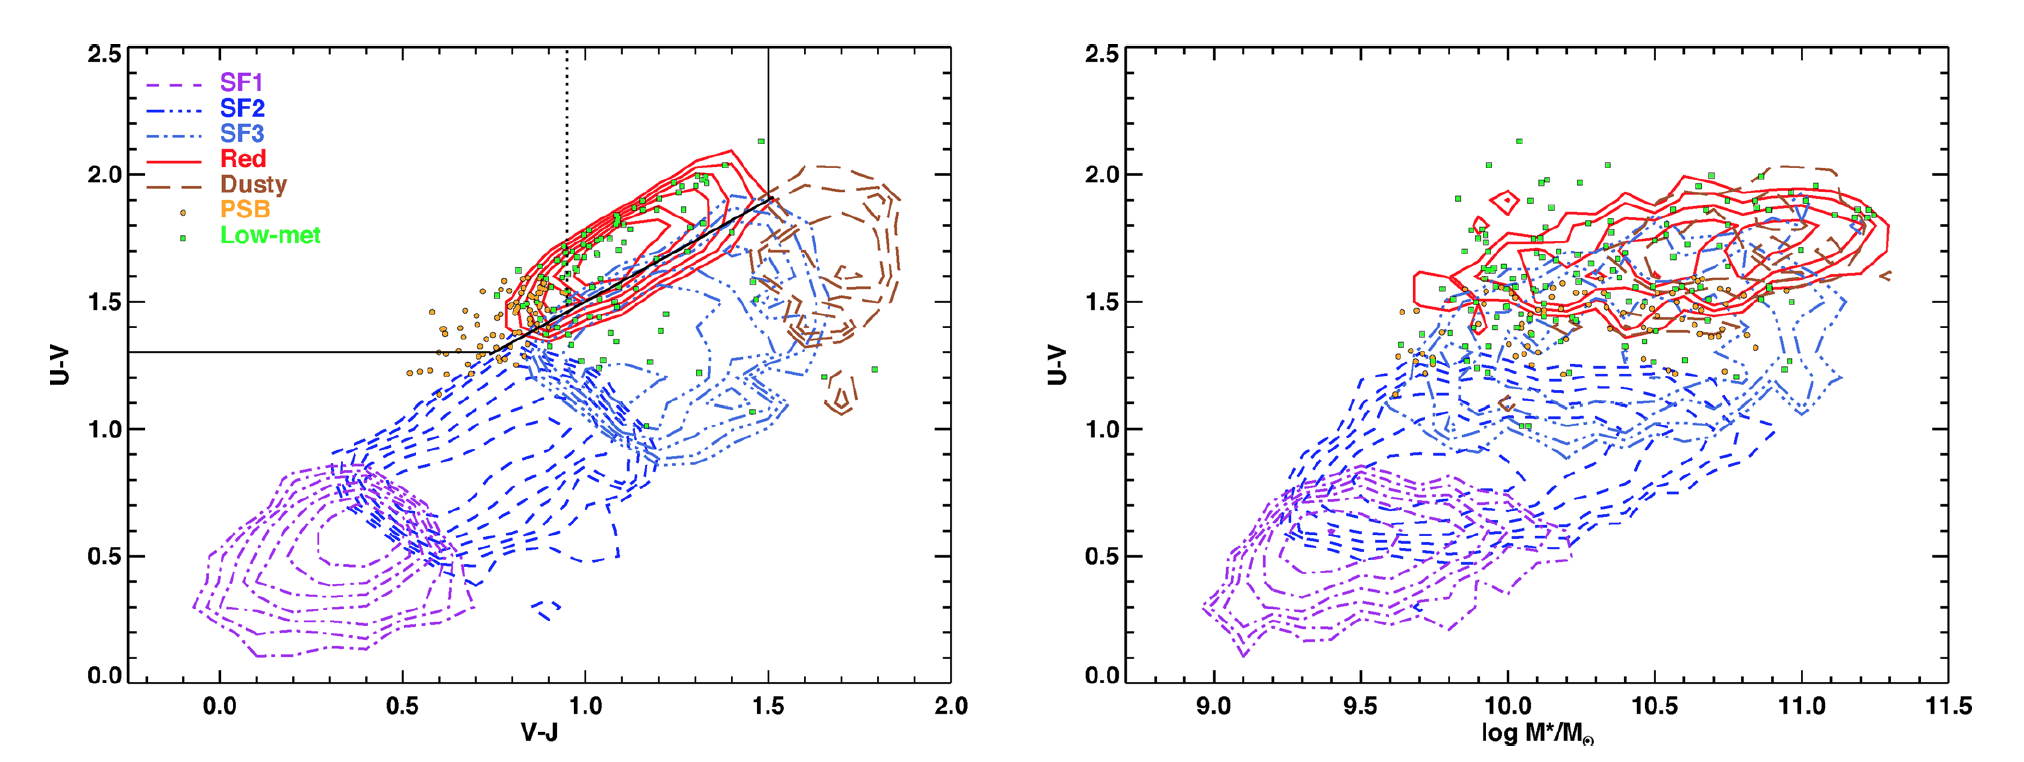
The K-corrected rest-frame UVJ colour–colour diagram (left) and colour–stellar mass diagram (right) of the UDS galaxies with 0.9 < z < 1.2. Contours show the loci of the primary classes as determined from their super-colours, symbols show where galaxies belonging to the two rarer classes lie. Black lines in the left-hand panel indicate the standard demarcation lines between red-sequence, blue-sequence and dusty star-forming galaxies. The dotted black line shows the cut used by Whitaker et al. (2012) to separate post-starburst galaxies from red-sequence galaxies.
We find that quiescent galaxies account for 45 per cent of galaxies with log M*/M⊙ > 11, declining steadily to 13 per cent at log M*/M⊙ = 10. The properties and mass function of the post-starburst galaxies are consistent with a scenario in which gas-rich mergers contribute to the growth of the low- and intermediate-mass range of the red sequence.
Broad-band photometry contains considerable information about the physical properties of galaxies, but simple K-corrected rest frame colour–colour diagrams fail to capture a significant fraction of the information and can be biased by poor model fits. Physical properties derived from SED fitting are prior dependent, and physical properties will be biased when models do not fit the SED shape of the data. Such biases are difficult to spot when errors on individual galaxies are large, and individual galaxies are fitted in isolation with no way to group objects with similar properties prior to fitting.
This method is a complementary approach to visualize the SED shapes of galaxy populations, allowing the stacking of populations with the same SED shapes. Such properties make it useful in identifying populations with interesting physical properties, as well as identifying areas where the spectral synthesis models need some improvement.
Publication
An extended description of the method can be found in Wild et al. 2014, MNRAS, 1880, 98.