Survey Design
The HUGS survey was designed to cover the two CANDELS fields accessible from Paranal that do not have suitably-deep K-band images: a sub-area of the UKIDSS Ultra Deep Survey (UDS) and GOODS-South (GOODS-S).
The depth of the images was chosen to be 0.5mag shallower than obtained with WFC3/IR in H160, as appropriate to match the average H-K color of faint galaxies.
In the UDS field deep Y-band images have also been acquired. They are an essential complement to the CANDELS data set, since neither Y098 nor Y105 imaging of this field has been obtained within CANDELS.
UDS pointings
We show the position of the three different pointings (named UDS1, UDS2 and UDS3). It can be seen that the three pointings also provide two overlapping regions that have been used to cross-check the photometric and astrometric solutions in the three individual mosaics. The three pointings have been exposed with nearly identical exposure times, of 8 hours in the Y band and 13 hours in the K band.
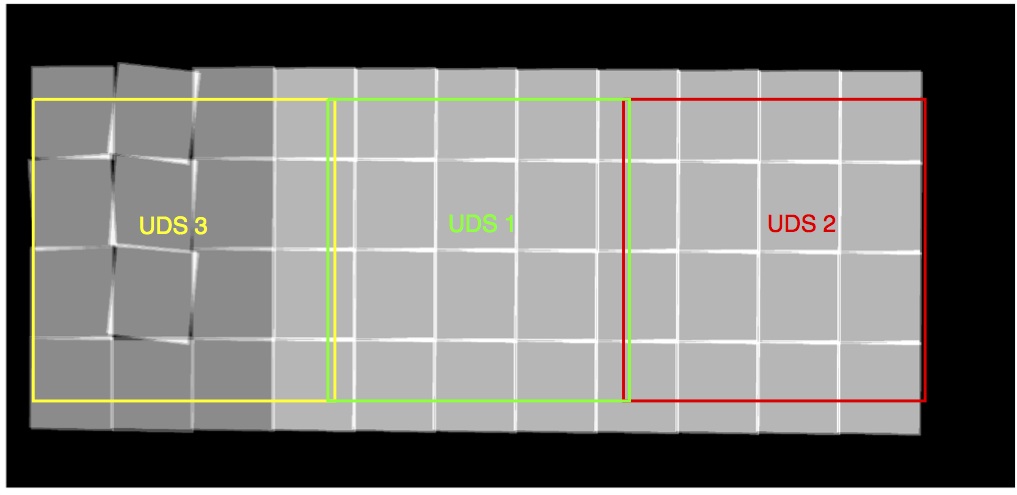
The location of the three Hawk-I pointings overlaid on the exposure map of the WFC3-CANDELS mosaic of the UDS. The greyscale of the WFC3/IR images is on a linear stretch from 0 to 4ks
GOODS-S pointings
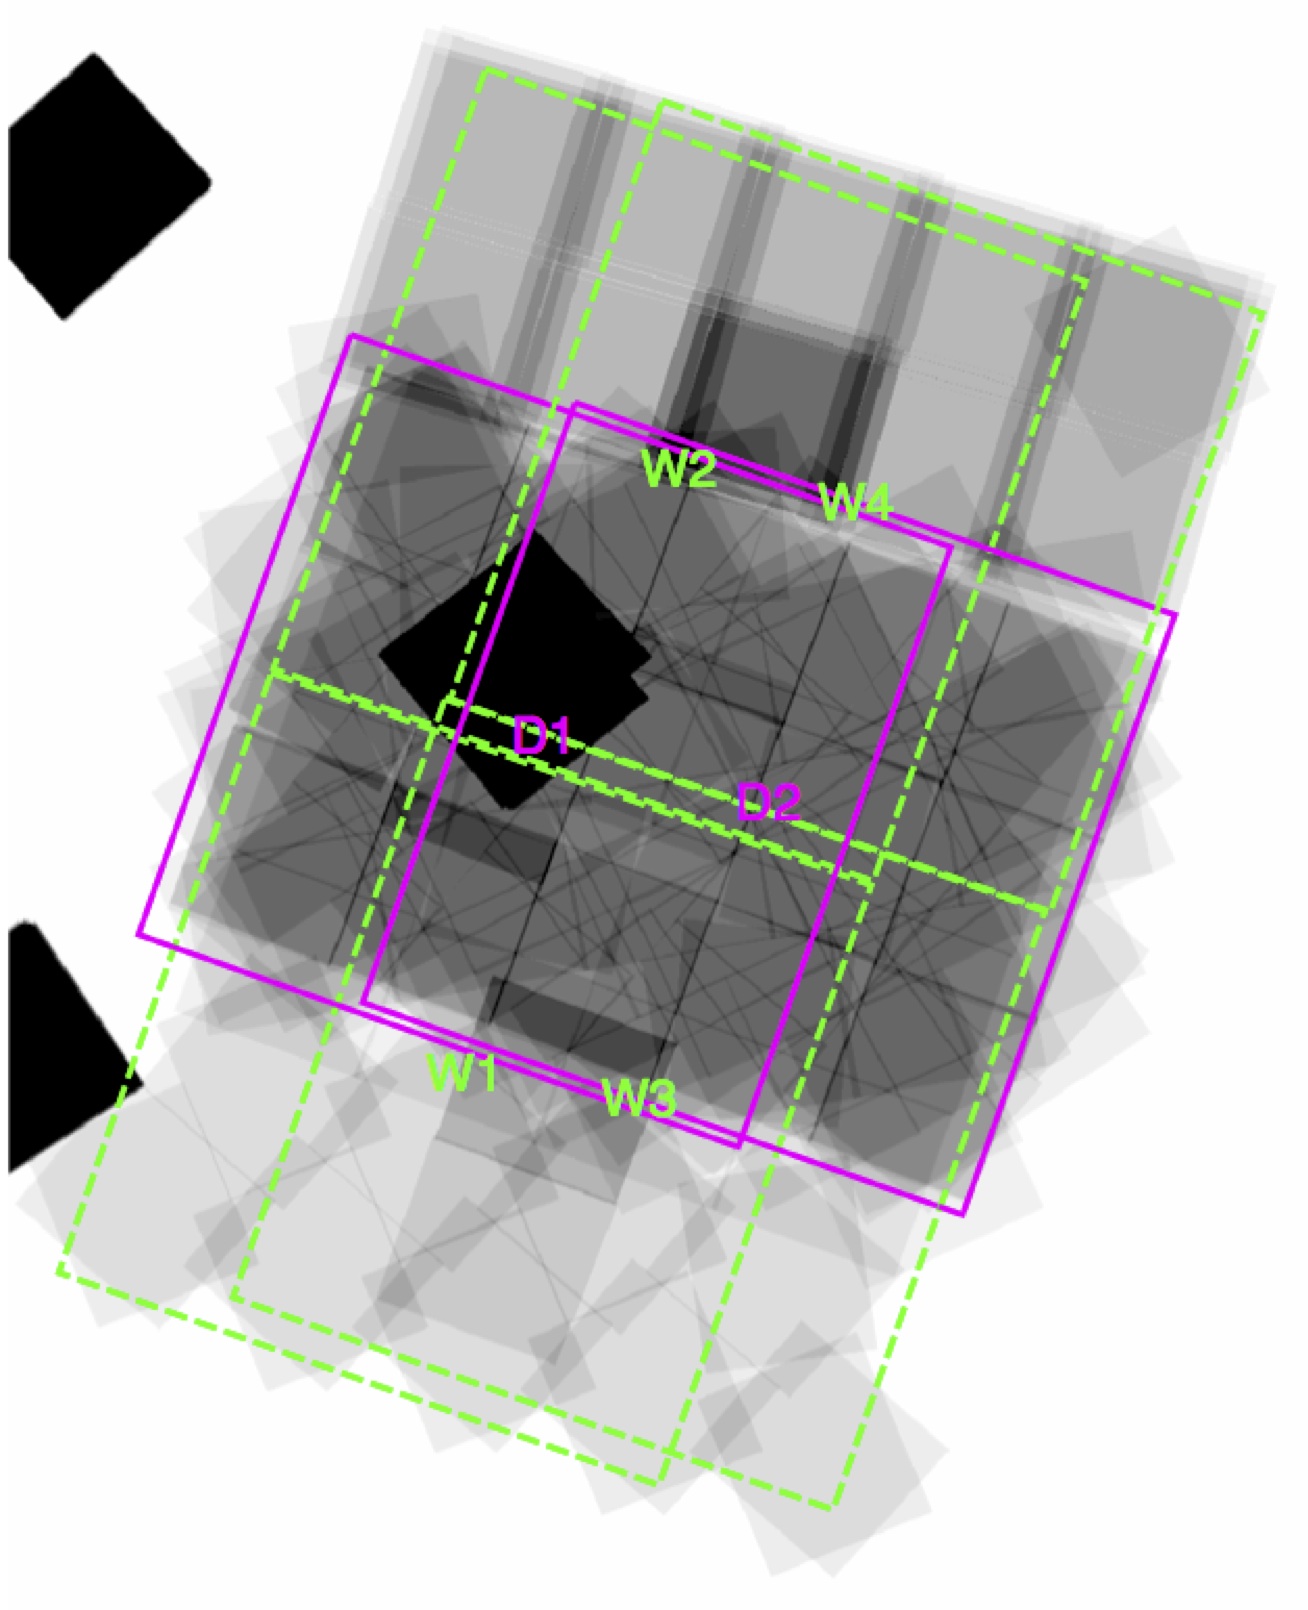
Location of the Hawk-I pointings overlaid
on the exposure map of the WFC3 data available within the GOODS-South field.
Magenta lines show the field-of-view of pointings D1 and D2, while the
green lines show pointings W1, W2, W3 and W4.
The black square at the centre is the HUDF12 region (Koekemoer et al. 2013).
The greyscale of the WFC3/IR
images is on a linear stretch that saturates at the deepest levels
of the CANDELS data; the HUDF12 is deeply oversaturated
The coverage of the GOODS-S field with CANDELS is more complex, and forced us to adopt a more complicated pattern.
Our final layout has been designed to deliver a deeper image over the central, deeper area (named GOODS-Deep), while covering nearly the entire shallower CANDELS+ERS area (GOODS_Wide).
We therefore decided to cover the whole field with a 2×3 grid of pointings, as shown below: we show both the position of the 6 individual pointings overlaid upon the WFC3 exposure map (that includes also the position of the UDF and the other parallel deep fields) as well as the final exposure map.
The two central pointings have been exposed for a total of about 31 hours, while the four upper and lower pointings have been exposed for about 11 hours each. We therefore name GD1 and GD2 the two deep exposures, and GW1, GW2, GW3, GW4 the four shallower ones.
In its central deeper area hat covers most of the UDF the exposure time reaches about 85 hours of exposure time in the very central area, and still reaches more than 40 hours of exposure time over the remaining part of the GOODS-Deep area. This image currently provides a unique combination of depth and area in the K-band.
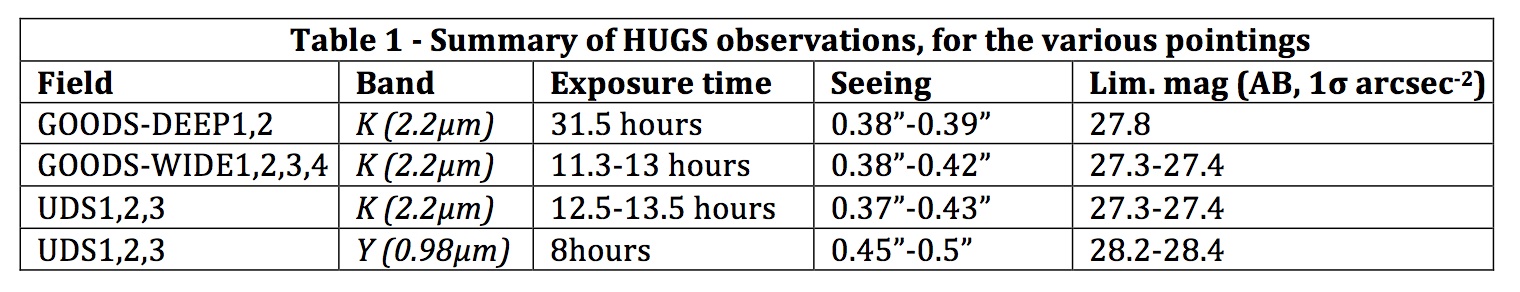
Summary of observations
HUGS Data Release
The public release of the HUGS data includes coadded images of the individual pointings, as well as full mosaics.
We remark that the most accurate scientific analysis is, for most application, obtained by separately using the individual pointings and then combining the output in an appropriate way, as we did for the derivation of the multicolor catalogues in the UDS (Galametz et al 2013).
Each data set is made of tar file including science data, the relevant r.m.s. and weight-image.
r.m.s. images contain the flux-calibrated error on each pixel, that is computed during the data reduction procedure. We advice to use this image when running SExtractor with WEIGHT_TYPE = RMS
For consistency with the ESO public release we also distribute the weight images that are simply weight=1/rms^2
All images (science and absolute rms) are flux calibrated in nJy and yields AB magnitudes if a zeropoint of 31.4 is adopted.
Please refer to the HUGS paper for full details.
GOODS-S
The following data set are made available by clicking on the links below:
- Individual mosaics: A tar file containing all the 6 coadded images ( one for each pointing GOODS- D1, D2, W1, W2, W3 and W4). Exposure times are about 31.5 hours for the two deep pointings (D1 and D2) and 11-13hours for the four wide pointings (W1-W4).
- Homogenized-seeing mosaic: A global mosaic of the two fields in each band after homogenizing all images to the same PSF. This has been done by degrading the highest qual- ity images to the one with the poorest seeing.
- Natural-seeing mosaic: A global mosaic of the two fields in each band without any correction for the different PSFs. These mosaics have varying PSF across the fields (in a smooth way across the overlapping region) but do not show a varying degree of correlation in the background.
UDS
The following data set are made available by clicking on the links below:
- Individual mosaics in Y band and K band: A tar file containing all the 3 coadded images ( one for each pointing UDS1, 2 and3).
- Homogenized-seeing mosaic in Y band and K band: A global mosaic of the three fields in each band after homogenizing all images to the same PSF. This has been done by degrading the highest qual-ity images to the one with the poorest seeing.
- Natural-seeing mosaic in Y band and K band: A global mosaic of the three fields in each band without any correction for the different PSFs. These mosaics have varying PSF across the fields (in a smooth way across the overlapping region) but do not show a varying degree of correlation in the background.
We remark that the most accurate scientific analysis is, for most application, obtained by separately using the individual pointings and then combining the output in an appropriate way, as we did for the derivation of the multicolor catalogues in the UDS (Galametz et al 2013, and see below).
Released Catalogs
Single Band catalogs.
We have obtained K-band detected catalogs using the seeing-averaged images described above. Note that this is formally correct to avoid systematic effects across the field due to inhomogeneous coverage, but somewhat limits the possibility of detecting the faintest galaxies in the pointings with the best seeing. Catalogs have been obtained with SExtractor using a minimal detection area of 9 pixels and requiring S/N>3 in such an area. These catalogs are available upon requests to Adriano Fontana
Multiwavelength catalogs.
We have included the photometry extracted from the HUGS images (both in K and in Y) in the UDS and GOODS multiwavelength catalogues described in Galametz et al 2013 and Guo et al 2013 respectively. In both cases we have detected the objects in the WFC3 H-band image from CANDELS, and performed PSF-matched photometry on the HUGS images.
This has been accomplished by using the TFIT package (Laidler et al. 2007) to properly take into account the morphology of each object during the deblending process.
The GOODS-S originally published in Guo et al. 2013 was compiled using only the first epoch of Hawk-I images in GOODS-S. We have therefore re-extracted the K-band photometry using the final images described here, for all the objects detected in the H-band. This catalogue is released here.