We report the LBT/MODS1 spectroscopic confirmation of two images of faint Lyman alpha emitters at z = 6.4 behind the Frontier Fields galaxy cluster MACSJ0717.5+3745. A wide range of lens models suggests that the two images are highly magnified, with a strong lower limit of μ > 5. These are the faintest z > 6 candidates spectroscopically confirmed to date. These may be also multiple images of the same z = 6.4 source as supported by their similar intrinsic properties, but the lens models are inconclusive regarding this interpretation. To be cautious, we derive the physical properties of each image individually. Thanks to the high magnification, the observed near-infrared (restframe ultraviolet) part of the spectral energy distributions and Lyα lines are well detected with S/N(m1500) > 10 and S/N(Lyα) ≃ 10 − 15. Adopting μ > 5, the absolute magnitudes, M1500, and Lyα fluxes, are fainter than −18.7 and 2.8×10⁻¹⁸ ergs−1cm−2, respectively. We find a very steep ultraviolet spectral slope β = −3.0 ± 0.5 (Fλ = λβ), implying that these are very young, dust-free and low metallicity objects, made of standard stellar populations or even extremely metal poor stars (age < 30Myr, E(B-V)=0 and metallicity 0.0 − 0.2Z/Z⊙). The objects are compact (< 1kpc2), and with a stellar mass M* < 108M⊙. The presence of the Lyα line and the intrinsic FWHM (< 300 kms−1) of these newborn objects do not exclude a possible leakage of ionizing radiation. We discuss the possibility that such faint galaxies may resemble those responsible for cosmic reionization.
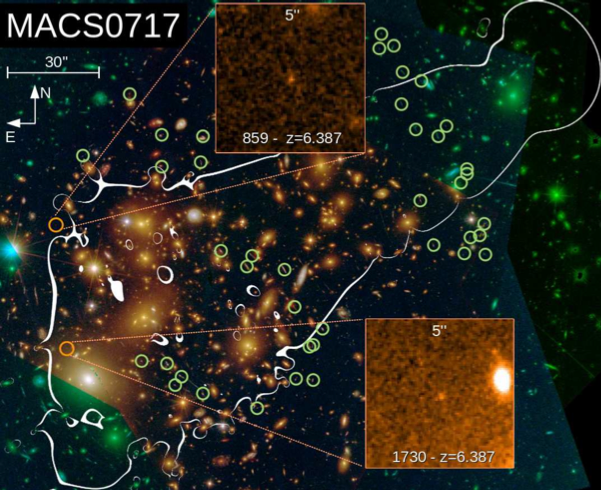
Figure 1: The 16-band CLASH RGB false-color image of MACSJ0717.5+3745, with the two z = 6.4 spectroscopically confirmed images marked with red circles (the insets show the J125 zoom). The critical curves (μ > 100 here) for a source at zs = 6.4 from the revised Zitrin et al. model are overlaid in white. The green circles mark the multiple images used as constraints (see Zitrin et al. 2009, Limousin et al. 2012, Medezinski et al. 2013). As can be seen, the two z = 6.4 objects lay (a) close to the critical curves, and (b) in regions in which there are hardly other multiple images known, so that the exact position of the critical curves is not perfectly constrained. The proximity to the critical curves results in very high magnifications, of the order of few to few dozen, and correspondingly, large errors on these estimates. Still, all probed models (see §2.1) yield μ > 5 for both images, which we have adopted throughout this work as our lower limit, for conservative results.
Figure 1 shows the 16-band CLASH RGB false-color image of MACSJ0717.5+3745, with the two z = 6.4 spectroscopically confirmed images marked with red circles (the insets show the J125 zoom). The critical curves (μ > 100 here) for a source at zs = 6.4 from the revised Zitrin et al. model are overlaid in white. The green circles mark the multiple images used as constraints (see Zitrin et al. 2009, Limousin et al. 2012, Medezinski et al. 2013). As can be seen, the two z = 6.4 objects lay (a) close to the critical curves, and (b) in regions in which there are hardly other multiple images known, so that the exact position of the critical curves is not perfectly constrained. The proximity to the critical curves results in very high magnifications, of the order of few to few dozen, and correspondingly, large errors on these estimates.
The spectroscopic observations have been performed in dual mode with the MODS1 instrument at the LBT, that exploits the two red (5800-10300Å) and blue (3200- 6000Å) channels, yielding a total spectra coverage from 3200 to ∼10300Å on source. The red G670L and blue G400L grisms with a slit width of 1′′ have been adopted, providing a spectral resolution of R ≃ 1500 for both. Sci- ence frames of 1200s have been acquired with a dithering pattern of 1.5′′ shift along the slit for a total integration time of 16800s for 859, and 11200s for 1730. The average seeing conditions were ≃ 1.0′′. Data reduction has been performed with the MODS1 spectroscopic reduction pipeline based on VIPGI tasks (Scodeggio et al. 2005).4 In the two slits located on 859 and 1730, two emission lines are clearly detected at 8980Å and 8981Å, respectively, with observed fluxes of 1.4 × 10⁻¹⁷ergs−1cm−2 (with S/N = 15) and ≃ 1.0 × 10⁻¹⁷ergs−1cm−2 (with S/N = 9), respectively (see figure 2).
![Panel (A): the position of targets 859 (top) and 1730 (bottom) in the MODS1 slits over the J125 band are shown. Panel (B): the two dimensional spectra, the Lyα lines (marked with a green circle), the sky spectrum and the CLASH multi-band cutouts (1.5′′) are shown. Panel (C): The Lyα line of 859 compared with a low-z [OII] doublet identified in the same mask (filler object) is shown.](http://ia2-guest.oats.inaf.it/wp-content/uploads/2014/01/02.png)
Panel (A): the position of targets 859 (top) and 1730 (bottom) in the MODS1 slits over the J125 band are shown. Panel (B): the two dimensional spectra, the Lyα lines (marked with a green circle), the sky spectrum and the CLASH multi-band cutouts (1.5′′) are shown. Panel (C): The Lyα line of 859 compared with a low-z [OII] doublet identified in the same mask (filler object) is shown.
For more details, the whole article can be found here