We study the evolution of the dust temperature of galaxies in the SFR- M* plane up to z ~ 2 using far-infrared and sub-millimetre observations from the Herschel Space Observatory taken as part of the PACS Evolutionary Probe (PEP) and Herschel Multi-tiered Extragalactic Survey (HerMES) guaranteed time key programmes.
Starting from a sample of galaxies with reliable star-formation rates (SFRs), stellar masses (M*) and redshift estimates, we grid the SFR- M* parameter space in several redshift ranges and estimate the mean dust temperature (Tdust) of each SFR-M* – z bin. Dust temperatures are inferred using the stacked far-infrared flux densities (100-500 mum) of our SFR-M* – z bins. At all redshifts, the dust temperature of galaxies smoothly increases with rest-frame infrared luminosities (LIR), specific SFRs (SSFR; i.e., SFR/M*), and distances with respect to the main sequence (MS) of the SFR- M* plane (i.e., Deltalog (SSFR)MS = log [SSFR(galaxy)/SSFRMS(M*,z)]). The Tdust – SSFR and Tdust – Deltalog (SSFR)MS correlations are statistically much more significant than the Tdust – LIR one. While the slopes of these three correlations are redshift-independent, their normalisations evolve smoothly from z = 0 and z ~ 2. We convert these results into a recipe to derive Tdust from SFR, M* and z, valid out to z ~ 2 and for the stellar mass and SFR range covered by our stacking analysis.
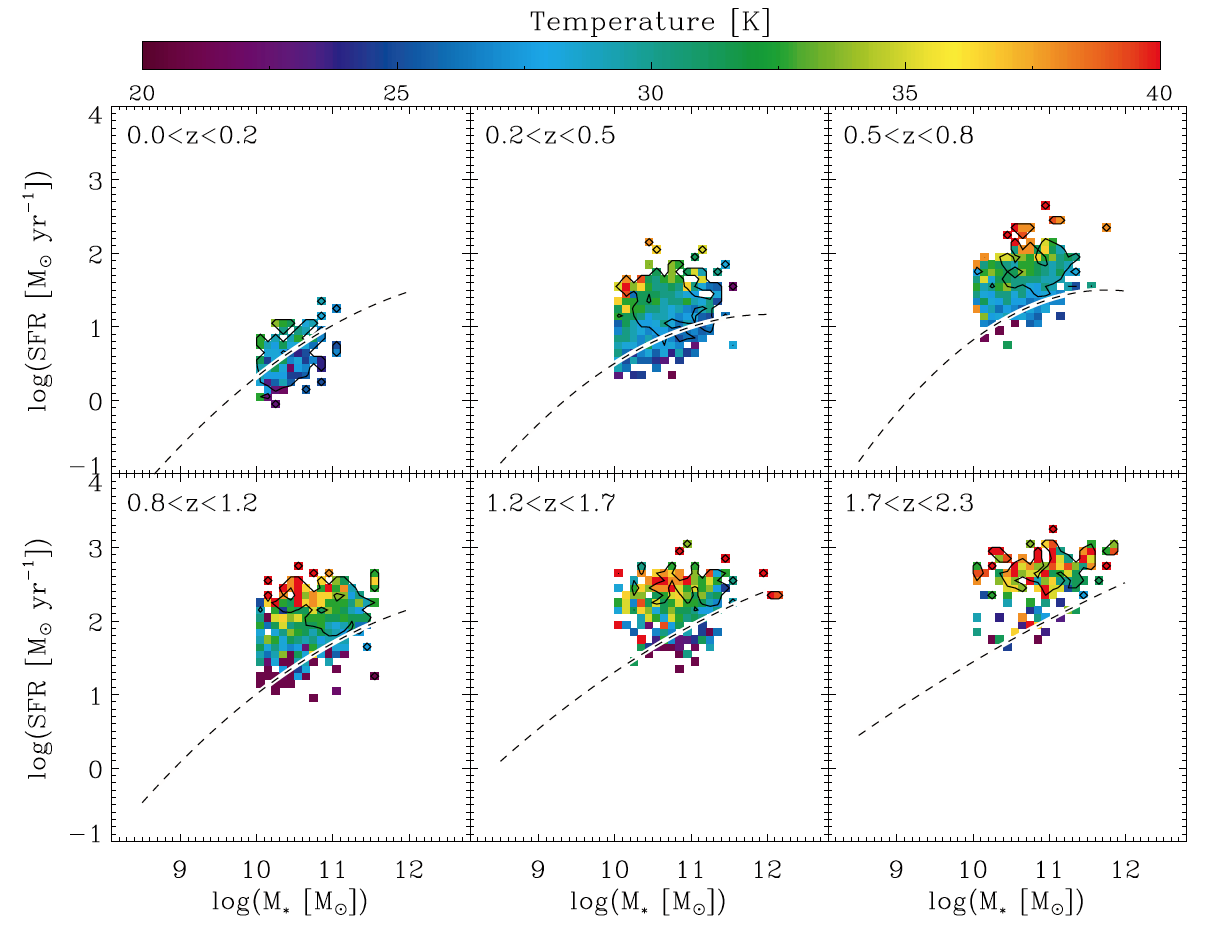
Mean dust temperature of galaxies in the SFR−M∗ plane as found from individual detections. Short-dashed lines on a white background show the MS of star formation. Solid contours indicate the regions in which at least 50% of the galaxies have accurate dust temperature estimates. Outside these regions results have to be treated with caution, because they are inferred from incomplete samples. Tracks of iso-dust-temperature are not characterised by vertical or horizontal lines but instead by approximately diagonal lines.
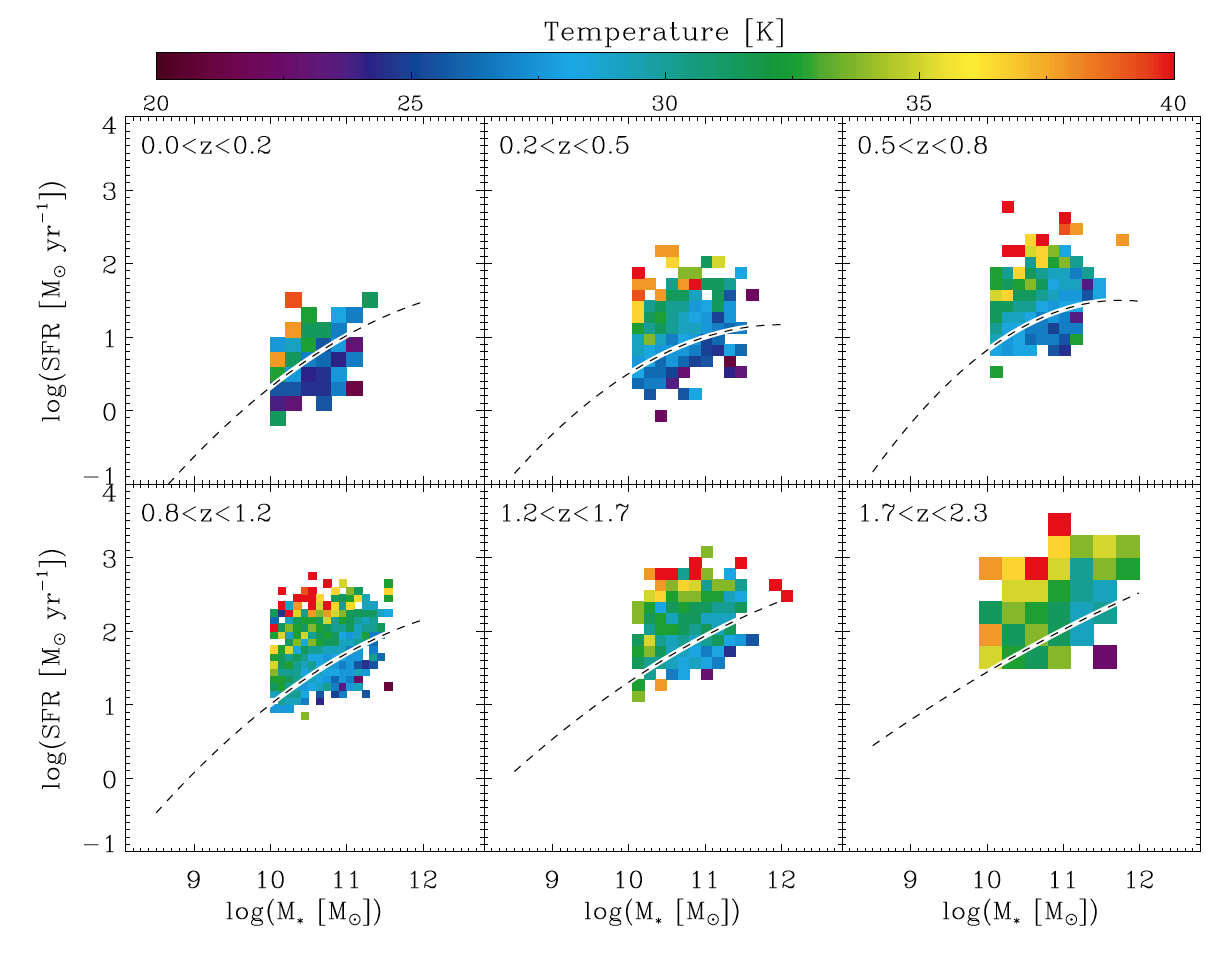
Mean dust temperature of galaxies in the SFR−M∗ plane as found from our stacking analysis. Short-dashed lines on a white background show the MS of star formation. Tracks of isodust- temperature are not characterised by vertical or horizontal lines but instead by approximately diagonal lines.
The existence of a strong Tdust – Deltalog (SSFR)MS correlation provides us with several pieces of information on the dust and gas content of galaxies. Firstly, the slope of the Tdust – Deltalog (SSFR)MS correlation can be explained by the increase in the star-formation efficiency (SFE; SFR/Mgas) with Deltalog (SSFR)MS as found locally by molecular gas studies. Secondly, at fixed Deltalog (SSFR)MS, the constant dust temperature observed in galaxies probing wide ranges in SFR and M* can be explained by an increase or decrease in the number of star-forming regions with comparable SFE enclosed in them. And thirdly, at high redshift, the normalisation towards hotter dust temperature of the Tdust – Deltalog (SSFR)MS correlation can be explained by the decrease in the metallicities of galaxies or by the increase in the SFE of MS galaxies.
All these results support the hypothesis that the conditions prevailing in the star-forming regions of MS and far-above-MS galaxies are different. MS galaxies have star-forming regions with low SFEs and thus cold dust, while galaxies situated far above the MS seem to be in a starbursting phase characterised by star-forming regions with high SFEs and thus hot dust.
The full paper, including technical details about the dust temperature determination, can be found in Magnelli et al. 2014, A&A, 561, A86