The form and evolution of the galaxy stellar mass function (GSMF) at high redshifts provide crucial information on star formation history and mass assembly in the young Universe, close or even prior to the epoch of reionization.
We used the unique combination of deep optical/near-infrared/mid-infrared imaging provided by HST, Spitzer, and the VLT in the CANDELS-UDS, GOODS-South, and HUDF fields to determine the GSMF over the redshift range 3.5 ≤ z ≤ 7.5.
We used the HST WFC3/IR near-infrared imaging from CANDELS and HUDF09, reaching H ≃ 27 – 28.5 over a total area of 369 arcmin2, in combination with associated deep HST ACS optical data, deep Spitzer IRAC imaging from the SEDS programme, and deep Y and K-band VLT Hawk-I images from the HUGS programme, to select a galaxy sample with high-quality photometric redshifts. These have been calibrated with more than 150 spectroscopic redshifts in the range 3.5 ≤ z ≤ 7.5, resulting in an overall precision of σz/ (1 + z) ~ 0.037. With this database we have determined the low-mass end of the high-redshift GSMF with unprecedented precision, reaching down to masses as low as M∗ ~ 109 M⊙ at z = 4 and ~6 × 10⁹ M⊙ at z = 7.
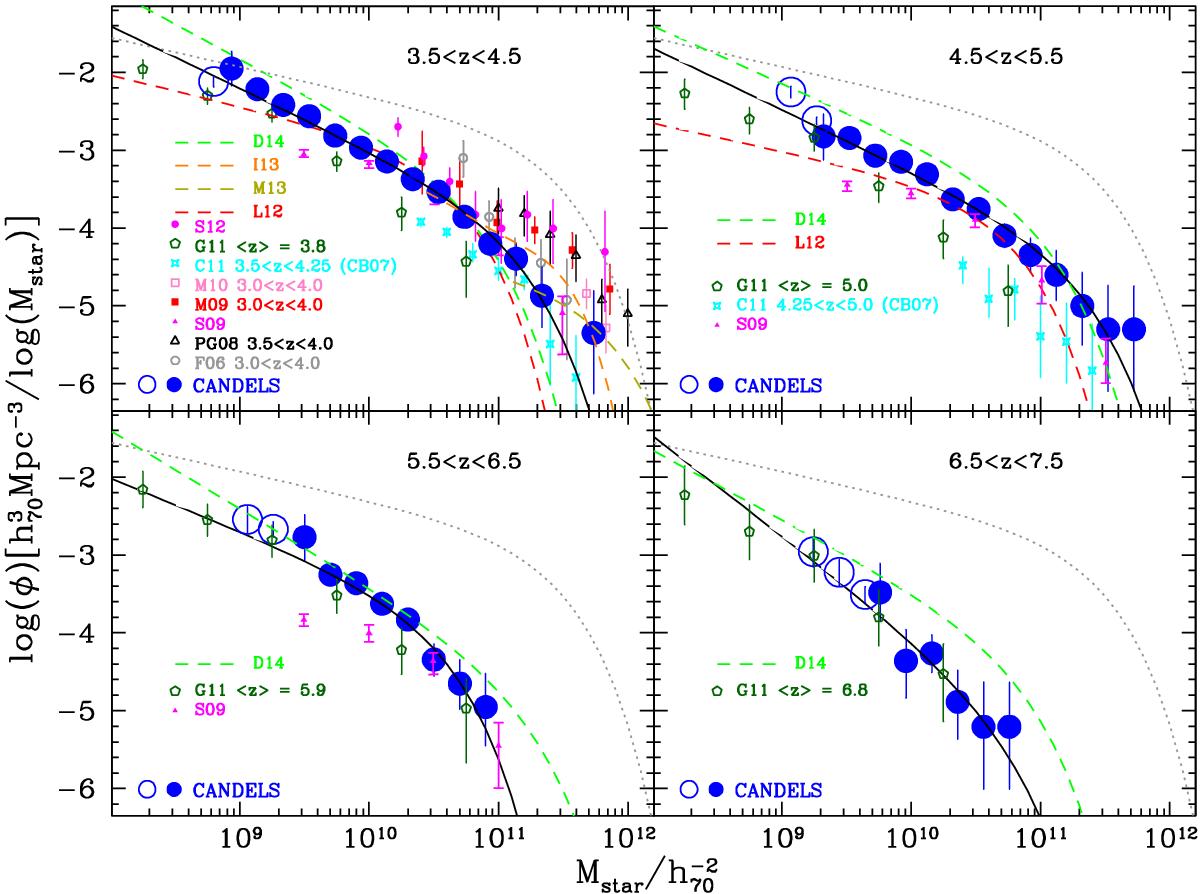
Stellar mass function of galaxies at 3.5 ≤ z ≤ 7.5 in the CANDELS UDS and GOODS-South fields (blue filled and open circles). The error bars show the Poissonian uncertainties of each point with the errors derived through the Monte Carlo simulations added in quadrature. The masses are derived using the BC03 libraries with exponentially declining star formation histories, and without any contribution from nebular lines or continuum. AGN were not included in the present sample. The dotted lines indicate the GSMF at z = 0.6 in the UDS and GOODS-South fields. The dark-green pentagons show the mass function derived by González et al. (2011; G11), while the cyan stars indicate the result of Caputi et al. (2011; C11), which was obtained with a different stellar library (Bruzual 2007) that includes a stronger contribution from TP-AGB stars. The black triangles are from Pérez-González et al. (2008; PG08), the red (empty and filled) squares from Marchesini et al. (2009; M09) and Marchesini et al. (2010; M10), respectively. The magenta points are the GSMF of Santini et al. (2012a; S12). The grey circles come from Fontana et al. (2006; F06) while the magenta triangles are from Stark et al. (2009; S09). The red, orange, dark-yellow and green dashed lines show the best fit GSMFs of Lee et al. (2012; L12), Ilbert et al. (2013; I13), Muzzin et al. (2013; M13) and Duncan et al. (2014; D14), respectively. All the mass functions have been converted to a Salpeter IMF for comparison. The solid continuous curves show the Schechter function derived through a parametric STY maximum likelihood fit.
We find that the GSMF at 3.5 ≤ z ≤ 7.5 depends only slightly on the recipes adopted to measure the stellar masses, namely the photometric redshifts, the star formation histories, the nebular contribution, or the presence of AGN in the parent sample. The low-mass end of the GSMF is steeper than has been found at lower redshifts, but appears to be unchanged over the redshift range probed here. Meanwhile the high-mass end of the GSMF appears to evolve primarily in density, although there is also some evidence of evolution in characteristic mass. Our results are very different from previous mass function estimates based on converting UV galaxy luminosity functions into mass functions via tight mass-to-light relations. Integrating our evolving GSMF over mass, we find that the growth of stellar mass density is barely consistent with the time-integral of the star formation rate density over cosmic time at z> 4.
Conclusions: These results confirm the unique synergy of the CANDELS+HUDF, HUGS, and SEDS surveys for the discovery and study of moderate/low-mass galaxies at high redshifts, and reaffirm the importance of space-based infrared selection for the unbiased measurement of the evolving GSMF in the young Universe.
Further details can be found in Grazian, A. et al. 2015, A&A, 575, 96