We present an analysis of the deepest Herschel images in four major extragalactic fields GOODS–North, GOODS–South, UDS, and COSMOS obtained within the GOODS–Herschel and CANDELS–Herschel key programs. The star formation picture provided by a total of 10 497 individual far-infrared detections is supplemented by the stacking analysis of a mass complete sample of 62 361 star-forming galaxies from the Hubble Space Telescope (HST) H band-selected catalogs of the CANDELS survey and from two deep ground-based Ks band-selected catalogs in the GOODS–North and the COSMOS-wide field to obtain one of the most accurate and unbiased understanding to date of the stellar mass growth over the cosmic history. We show, for the first time, that stacking also provides a powerful tool to determine the dispersion of a physical correlation and describe our method called “scatter stacking”, which may be easily generalized to other experiments. The combination of direct UV and far-infrared UV-reprocessed light provides a complete census on the star formation rates (SFRs), allowing us to demonstrate that galaxies at z = 4 to 0 of all stellar masses (M∗) follow a universal scaling law, the so-called main sequence of star-forming galaxies.
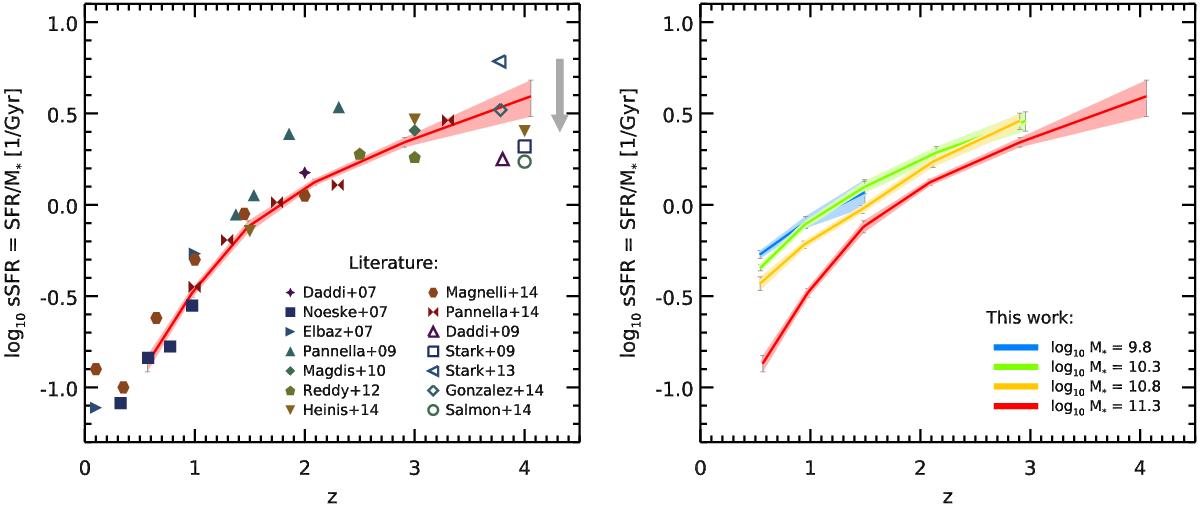
Evolution of the average sSFR of star-forming galaxies with redshift. Left: comparison of our results at M∗ = 2 × 10¹¹ M⊙ (red curve) to published values in the literature (filled and open symbols). Filled symbols compile various results that were derived from mass-complete samples with SFRs computed either from the IR (Daddi et al. 2007; Noeske et al. 2007; Elbaz et al. 2007; Magdis et al. 2010; Reddy et al. 2012; Heinis et al. 2014; Magnelli et al. 2014; Pannella et al. 2014) or the radio (Pannella et al. 2009, 2014). When possible, these were rescaled to a common stellar mass of 2 × 10¹¹ M⊙ using the corresponding published SFR–M∗ relations. Results from stacking have been corrected by −0.1 dex to reach the mode of the main sequence (see discussion in Sect. 3.2). Open symbols show results from the literature that make use of the Lyman break selection technique (LBGs) and where the SFRs are obtained from the UV light alone (Daddi et al. 2009; Stark et al. 2009, 2013; González et al. 2014; Salmon et al. 2015). These samples are mostly composed of galaxies of much lower stellar mass, typically 3 × 10⁹ M⊙, so the extrapolation to 1011 M⊙ is more uncertain. We therefore simply quote the published values. The gray arrow shows how the open symbols would move if we were to apply a mass correction assuming the z = 4 main sequence slope of Bouwens et al. (2012). When necessary, data from the literature have been converted to a Salpeter IMF. Right: same figure showing our other stacked mass bins with different colors.
We find a universal close-to-linear slope of the log 10(SFR)–log 10(M∗) relation, with evidence for a flattening of the main sequence at high masses (log 10(M∗/M⊙) > 10.5) that becomesless prominent with increasing redshift and almost vanishes by z ≃ 2. This flattening may be due to the parallel stellar growth of quiescent bulges in star-forming galaxies, which mostly happens over the same redshift range. Within the main sequence, we measure a nonvarying SFR dispersion of 0.3 dex: at a fixed redshift and stellar mass, about 68% of star-forming galaxies form stars at a universal rate within a factor 2. The specific SFR (sSFR = SFR/M∗) of star-forming galaxies is found to continuously increase from z = 0 to 4. Finally we discuss the implications of our findings on the cosmic SFR history and on the origin of present-day stars: more than two-thirds of present-day stars must have formed in a regime dominated by the “main sequence” mode. As a consequence we conclude that, although omnipresent in the distant Universe, galaxy mergers had little impact in shaping the global star formation history over the last 12.5 billion years.
The full paper can be found in Schreiber et al. 2015, A&A, 575, 74