What is HUGS: the deepest K-band survey ever.
HUGS (an acronym for Hawk- I UDS and GOODS Survey) is a ultra–deep IR imaging survey executed with the Hawk-I imager at the VLT, that observed in the K and Y bands the UDS and GOODS-South fields covered by the CANDELS survey.
The survey is a joint project between the Rome Observatory and the University of Edinburgh, and it is based on the data collected with a dedicated ESO Large Programs (P.I. A. Fontana) but includes all the imaging data taken with Hawk-I on the UDS and GOODS-S fields.
Thanks to exquisite image quality and extremely long exposure times, HUGS delivers the deepest K-band images ever collected over areas of cosmological interest, and in general ideally complement the CANDELS dataset in terms of image quality and depth.
When VLT meets HST.

The exposure map of the final HUGS image of the GOODS-South field, in the K
band. Darker regions corresponds to longer exposures. Overlaid are also the main WFC3 regions: CANDELS-deep (green large box), CANDELS-wide (blue), ERS (red), HUDF (small green)
In the deepest region, that includes most of the Hubble Ultra Deep Field, exposure times exceed 80 hours of integration, with a 1 − σ magnitude limit per square arcsec of about 28.0 mags (AB). The seeing is remarkably exceptional and constant across the various pointings, ranging between 0.38” and 0.43”. In the UDS field the survey is about one mangnite shallower, to match the correspondingly smaller depth of the CANDELS images, but includes also the Y band, where WFC3 is lacking. In the K band, with an average exposure time of 13 hours, and a seeing ranging from 0.37” to 0.43”, the 1 − σ magnitudes limit per square arcsec is about 27.3mags. In the Y–band the average exposure time is of about 8 hours, and an average seeing of 0.45”-0.5”, reaching 1 − σ magnitudes limit per square arcsec of about 28.3mags.

The centre of the deepest GOODS-S field as observed with Hawk-I in the K-band (upper) and with WFC3/IR in the H-band (lower). The displayed area is 1’ wide. Objects encircled have H≈26 and a colour H-K≈0.5, typical of faint galaxies.
The final quality of the output data is simply spectacular, and shows that Hawk-I on VLT is capable of approaching HST performances even in the case of near-IR deep imaging, where HST is unrivalled. This is shown in the figure on the right, where we compare the image obtained by HUGS in the center of GOODS-S with the image obtained with WFC3@HST from CANDELS, in the H band. It can be immediately appreciated that the depth and quality of the HUGS images is comparable in all aspects to the WFC3 data.
The public data release
All the HUGS images and catalogs are public through the ESO archive. QUICK LINK HERE
Further details about the data survey strategy and access to the data are available also here
Papers
There are two papers that describe the survey:
- An ESO Messenger paper, that can be used as a general introduction to the survey, and
- A full data paper (Fontana et al. 2014 A&A, 570, A11:) where all technical details are given.
Please acknowledge this paper whenever you use the HUGS data.
Deep K band number counts
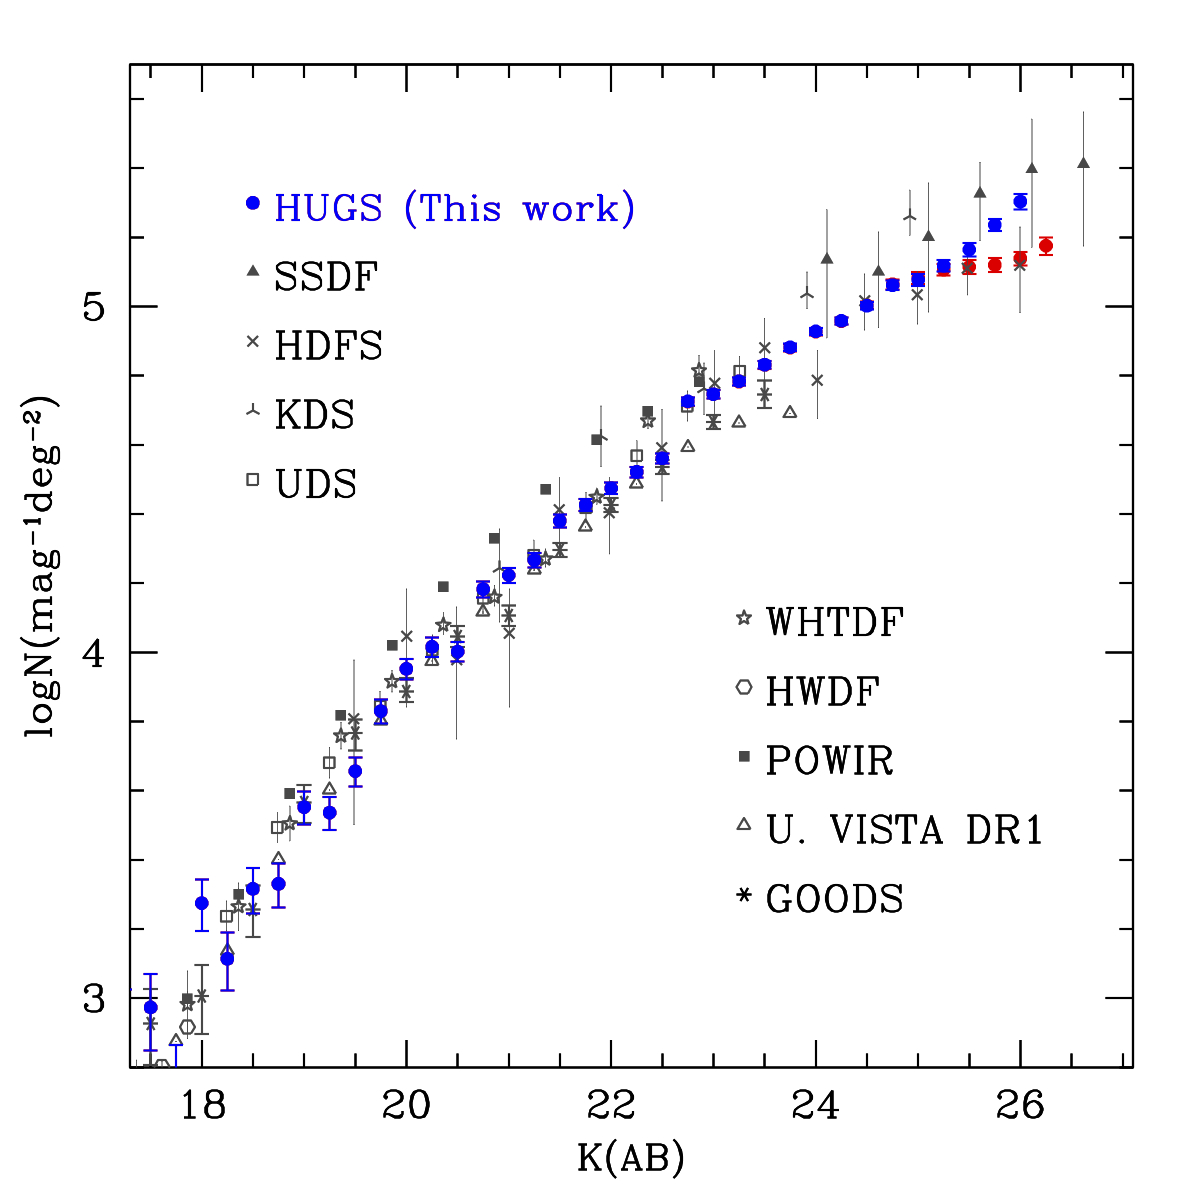
Number counts in the K-band, from HUGS and from the recent literature. In blue are the HUGS counts corrected for incompleteness assuming a faint galaxy size distribution spanning the range rhl = 0.1–0.3 arcsec. In red we show the counts that are derived assuming point-like sources.
The HUGS survey delivers the deepest wide-field K band number counts ever obtained.
They are shown in the figure here on the right. In blue are the HUGS counts corrected for incompleteness assuming a faint galaxy size distribution spanning the range rhl = 0.1–0.3 arcsec, while in red we show the counts that are derived assuming point-like sources.
A full description of the procedure adopted and of their implication is given in Fontana et al. 2014.
The table containing the plotted data is available HERE.